Interactive map of UK arts demographics
We used the Audience Agency's database of millions of (anonymised) bookers, placed into demographic categories using their Audience Spectrum system to plot the data onto an interactive map.
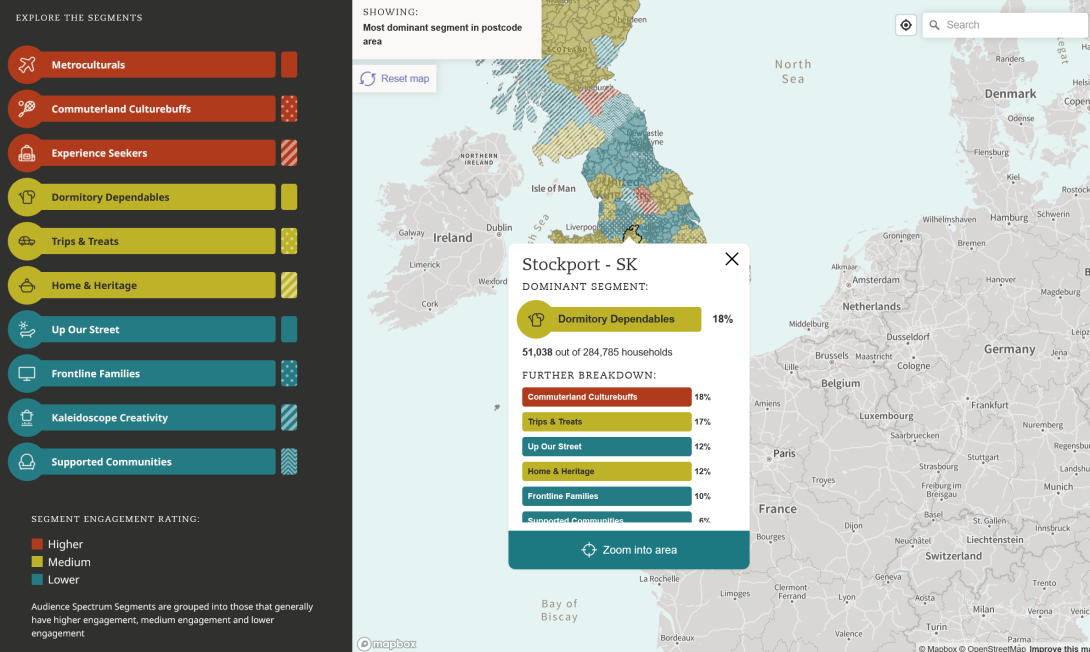
This map allows users to filter by area, demographic type and, through patterns, colour and chart popups view information broken down to whichever level they are interested in.
We built processing tools to turn the data into the correct format, and cached the data so that the map would perform quickly. We used multiple datasets for postcode areas in the UK and mapped them against the data to create searchable and filterable regions on the map.