UK Heartbeat - Live Twitter visualisation and analysis for eHarmony
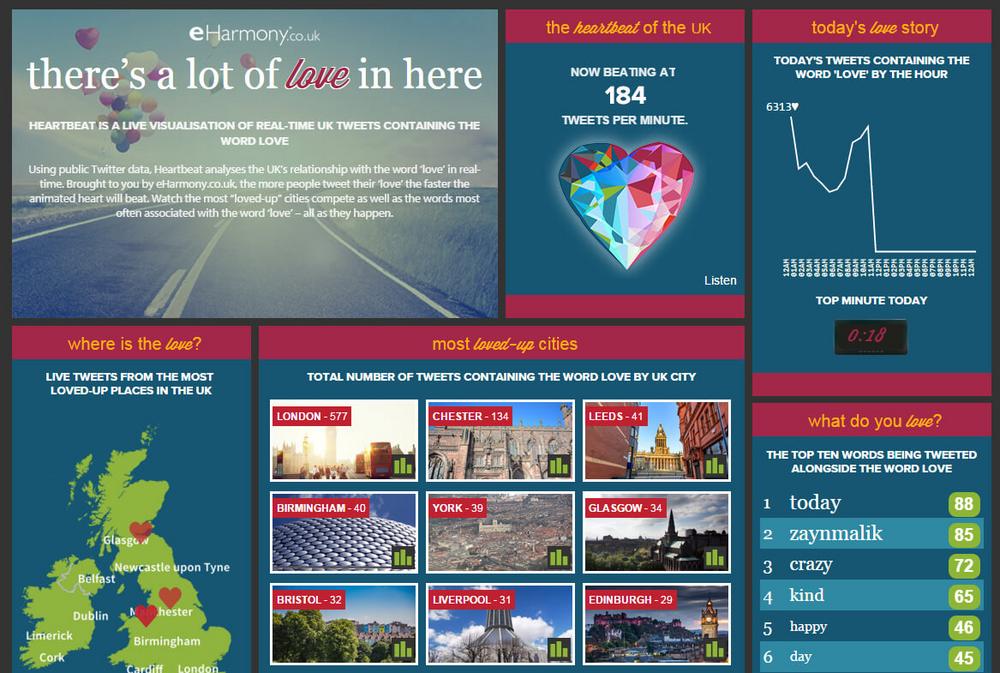
An Interactive Twitter multi level visualisation dashboard for the word “love”
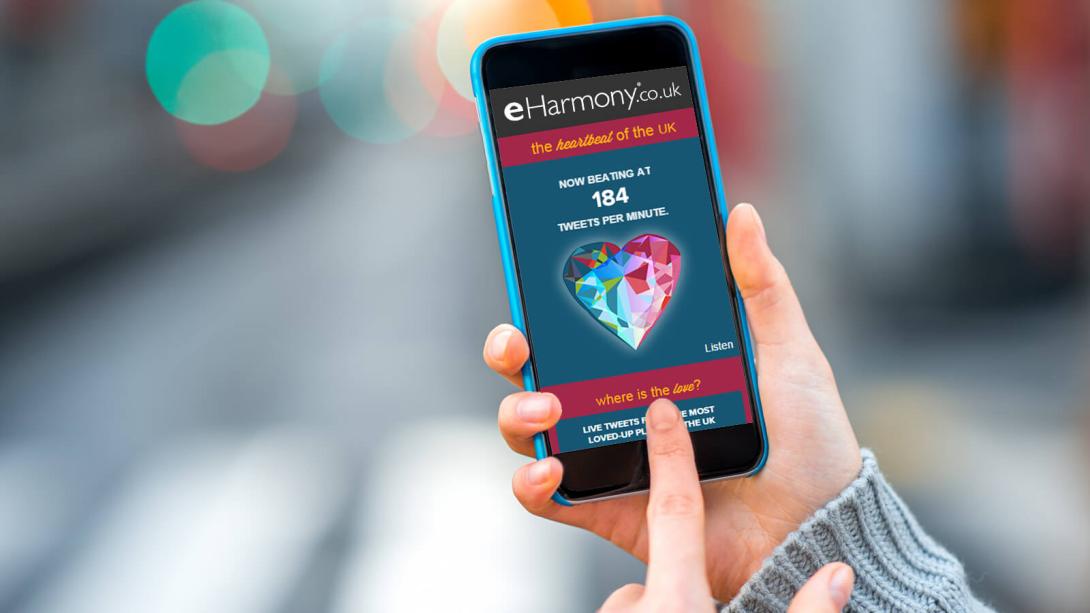
Launched on 1 February 2016, the app used Twitter’s Streaming APIs to analyse public tweets containing the word ‘love’ interpreting “love levels” to cause a digital animated heart to beat. The more loved up we felt as a nation, the bigger the heart appears and faster it beats (including an audio representation of the heartbeat).
The site for the first time revealed how overall interest in ‘love’ changes by time of the day, displaying a live heart rate monitor-style graph to track the hourly interest in love as well as the words most often associated with the word ‘love’ – all in real time.
The heartbeat enabled visitors to watch the shifting emotions, opinions, and exclamations of some of the UK’s 13 million Twitter users. Location-enabled tweets containing the l-word were also plotted live on a map of the United Kingdom.