TerrAdapt geospatial analysis and reporting dashboard
Visualising projections of changes in natural environments
TerrAdapt uses the latest remote sensing and cloud computing technologies to dynamically monitor natural environments, providing insights into the current status, recent trends and future projections in habitat and connectivity.
Since 2021 we have worked with the TerrAdapt team on several iterations of their interactive map and dashboard, allowing users to visualize and quantify change, and tell spatial stories about their area of interest.
Since 2021 we have worked with the TerrAdapt team on several iterations of their interactive map and dashboard, allowing users to visualize and quantify change, and tell spatial stories about their area of interest.
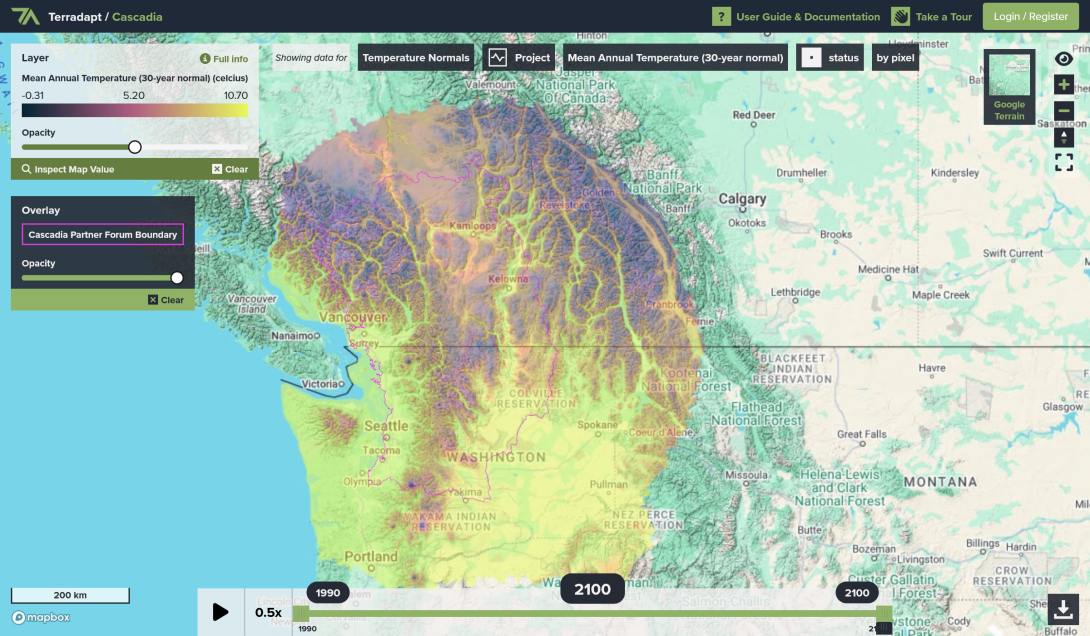
Octophin built interactive 3D maps, dashboards and charts that calculate trends and show animated changes in the environment over several decades in user uploaded and shared regions.
This complex multi-layered data can be viewed, shared, exported to video or spreadsheet and embedded in a user-friendly way to give land managers and conservation organisations the best tools to protect their environment.
Following its launch in Washington and southern British Columbia, the maps and dashboards have proved essential planning and reporting tools and have led to the technology being rolled out by government agencies across several other territories.
Data is run through Google Earth Engine to create layer visualisations that can be presented using Mapbox, organised, animated and recorded (video and image export) using the interface.
The system includes a user registration system allowing people to upload and perform calculations on custom areas of interest.